How to Debug an Angular Application With Chrome and vs Code
How to Debug an Angular Application With Chrome and vs Code
In this blog post I want to show you how to debug an Angular application with Chrome and VS Code.
First of all you need to install the extension in VS Code.
You can find it here
https://github.com/Microsoft/vscode-chrome-debug
or search in the extensions tab for the plugin directly:
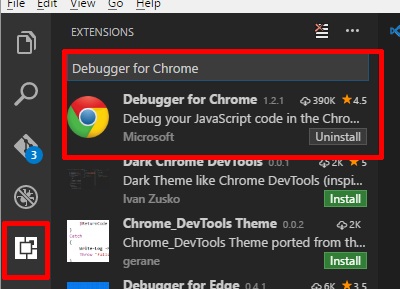
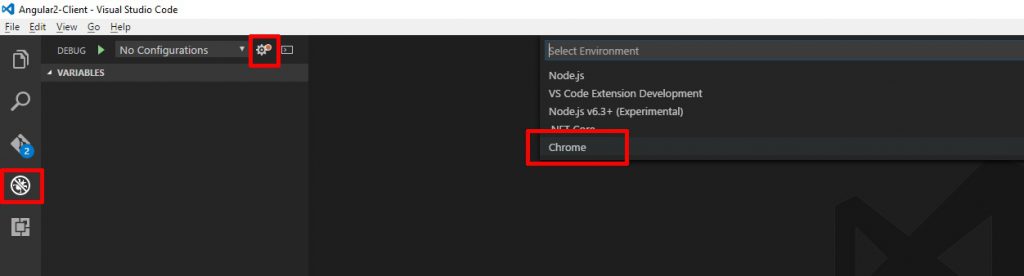
After installing you probably have to enable the plugin and restart VS Code but in the end you will see your folder structure like normal. Then head over to the debug tab and press the button for creating you an new configuration and select the “Chrome” environment.
After doing this the extension created a new folder (if you do not have it already) called “.vscode” and a “launch.json” in it initially looking like this:
{
    // Use IntelliSense to learn about possible attributes.
    // Hover to view descriptions of existing attributes.
    // For more information, visit: https://go.microsoft.com/fwlink/?linkid=830387
    "version": "0.2.0",
    "configurations": [
        {
            "type": "chrome",
            "request": "launch",
            "name": "Launch Chrome against localhost",
            "url": "http://localhost:8080",
            "webRoot": "${workspaceFolder}"
        }
    ]
}
Our folder strucutre tells us that the files are served from the root.
So, the "webRoot”: “\${workspaceRoot}”” setting is good to go for us. We will open a new Chrome instance but it needs an existing running server. So we have to start our angular application with npm start or the ng serve command in another console. But before we go we need to adjust the urls where the server is running on and the url where the Chrome instance is starting.
So replace the port in the config file with the port from your angular application. In my cae thats “4200”. This is how your config look like then:
{
    // Use IntelliSense to learn about possible attributes.
    // Hover to view descriptions of existing attributes.
    // For more information, visit: https://go.microsoft.com/fwlink/?linkid=830387
    "version": "0.2.0",
    "configurations": [
        {
            "type": "chrome",
            "request": "launch",
            "name": "Launch Chrome against localhost",
            "url": "http://localhost:4200",
            "webRoot": "${workspaceFolder}"
        }
    ]
}
If the server is running hit “play” in VSCode and the breakpoint should be hit. If not, it might not be attached, so hit refresh in the browser.
Chrome starts and you can debug your page in VS Code. Of course you can also configure Chrome to attach directly. See here for examples:
https://github.com/Microsoft/vscode-chrome-debug/wiki/Examples
Hope this helps anybody
BR
Fabian